Creates a `ggplot` plot of up to 3 different slices (one per anatomical plane) of the segmentation
seg_plot(
  segmentation,
  s_slice = NULL,
  c_slice = NULL,
  a_slice = NULL,
  smooth = TRUE,
  smoothness = 3,
  show_axis_rulers = TRUE,
  show_outline = TRUE,
  show_labels = FALSE,
  label_size = 2,
  minsize = 10,
  wrap_options = 1
)
Arguments
- segmentation
a
segmentationclass object- s_slice
numeric, the slice number (index) on the sagittal plane
- c_slice
numeric, the slice number (index) on the coronal plane
- a_slice
numeric, the slice number (index) on the axial plane
- smooth
logical, should polygons be smoothed before drawing? Default is
TRUE. Uses kernel smoothing.- smoothness
numeric, the argument passed to the kernel smoothing function.
- show_axis_rulers
logical, should rulers for each axis be shown in each view? Default is
TRUE.- show_outline
logical, should the maximum segmentation outline be plotted? Default is
TRUE.- show_labels
logical, should structure acronym labels be shown on the plot? Default is
FALSE.- label_size
numeric, the size of the labels.
- minsize
numeric, the minimum number of points to create a polygon. Any structure in the slice with fewer points than this number will be discarded. Default is 10.
- wrap_options
numeric, the number of rows for the facet wrapping. Default is 1.
Value
a `ggplot` object with the graph
Examples
array_cubes <- dummy_cubes(10)
ontology <- dummy_ontology()
seg <- seg_draw(
array = array_cubes,
ontology = ontology,
verbose = FALSE
)
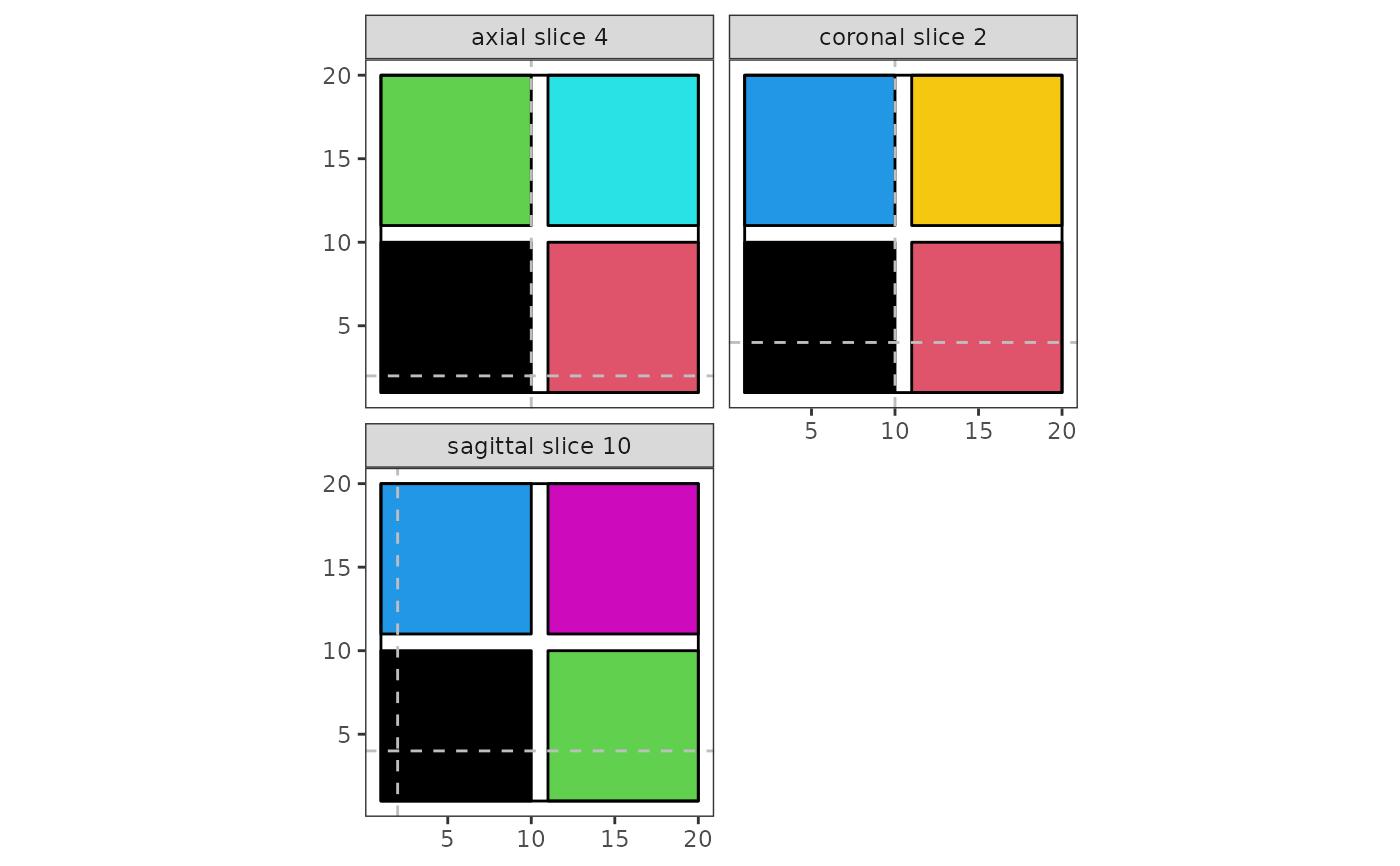
seg_plot(seg, s_slice = 10, a_slice = 4, c_slice = 2, smooth = FALSE)
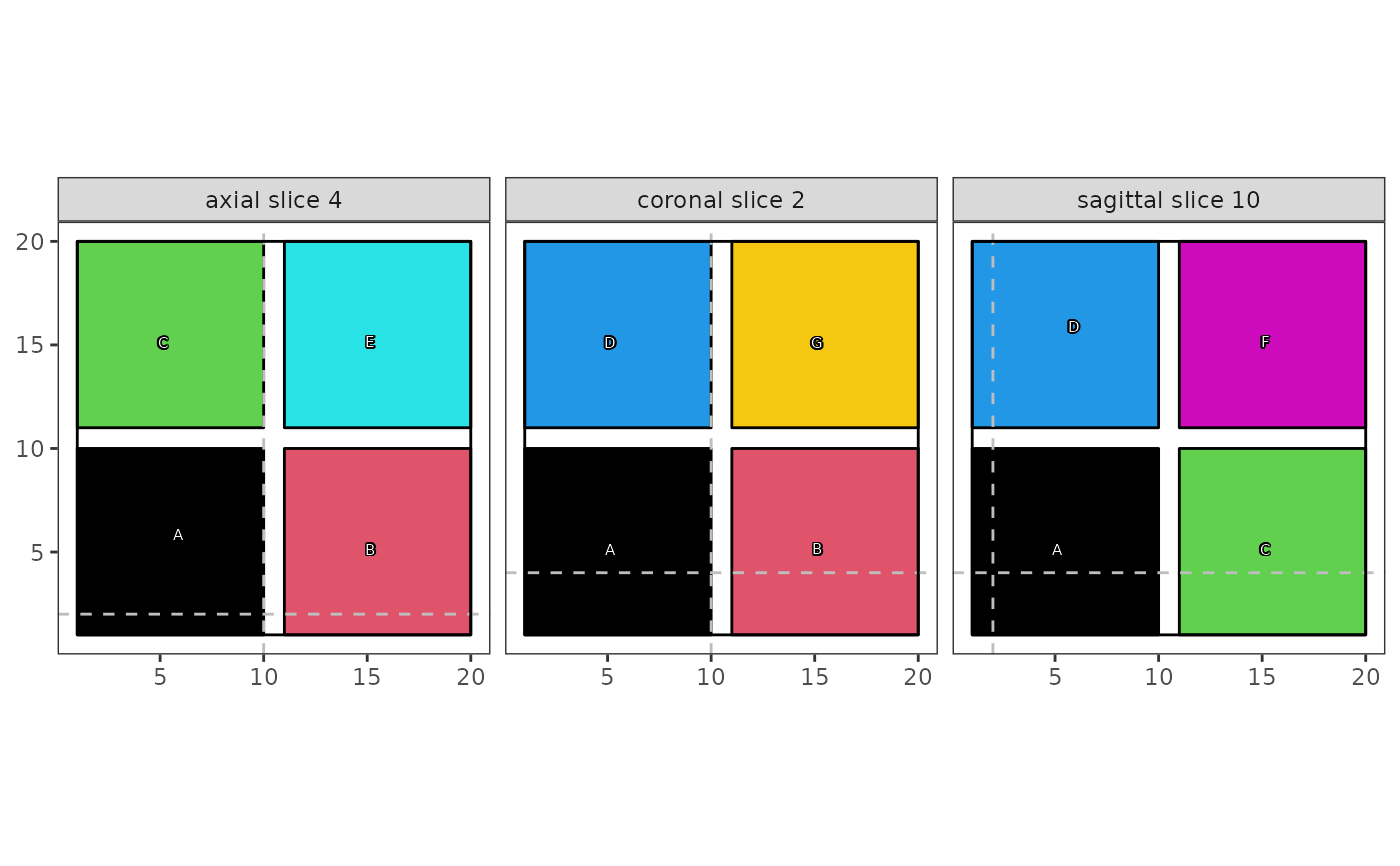
 # With labels
seg_plot(seg, s_slice = 10, a_slice = 4, c_slice = 2, smooth = FALSE,
show_labels = TRUE)
# With labels
seg_plot(seg, s_slice = 10, a_slice = 4, c_slice = 2, smooth = FALSE,
show_labels = TRUE)
 # Different wrap options:
seg_plot(seg, s_slice = 10, a_slice = 4, c_slice = 2, smooth = FALSE,
wrap_options = 2)
# Different wrap options:
seg_plot(seg, s_slice = 10, a_slice = 4, c_slice = 2, smooth = FALSE,
wrap_options = 2)